1. 概述
Operator 就是一个自己开发的控制器用来管理自定义的资源,Prometheus Operator 就是把Prometheus 监控体系涉及到的所以组件及相关配置都变成自定义资源,然后由自定义的控制器来实现自动化管理。
自定义资源种类:
- Prometheus 资源:创建运行 Prometheus Server 的 Pod
- ServiceMonitor 资源:会转换成监控的 target 然后注入到 Prometheus Server 的配置文件中,并且自动 Reload。
- prometheusRule 资源:会转换成报警规则然后注入到 Prometheus Server 的配置文件中,并且自动 Reload。
- alermanager 资源:创建运行 alertmanager 组件的 Pod。
- alermanager 的配置资源:会转换成配置然后注入到 alertmanager服务的配置中,并且自动重载。
ServiceMonitor 和 PrometheusRule 解决了 Prometheus 配置难维护问题,开发者不再需要通过修改 ConfigMap 把配置文件更新到 Pod 内再手动触发 webhook 热更新,只需要修改这两个对象资源就可以了。
2. 部署一整套监控技术栈组件
下载:
# 到官网 https://github.com/prometheus-operator/kube-prometheus 查看兼容的版本下载
git clone https://github.com/prometheus-operator/kube-prometheus.git

# 切换到 release-0.15 版本,根据自己的环境选择
git checkout release-0.15

# 验证版本
git describe --tags
v0.15.0-2-gc038b94f修改配置:
# 修改 grafana-service.yaml、prometheus-service.yaml 增加 NodePort 配置,便于集群外访问服务的 Web 页面
# kube-prometheus/manifests/grafana-service.yaml
apiVersion: v1
kind: Service
metadata:
  labels:
    app.kubernetes.io/component: grafana
    app.kubernetes.io/name: grafana
    app.kubernetes.io/part-of: kube-prometheus
    app.kubernetes.io/version: 12.1.0
  name: grafana
  namespace: monitoring
spec:
  type: NodePort  # 添加Service类型为NodePort
  ports:
  - name: http
    port: 3000    # 集群内部访问端口
    targetPort: http
    nodePort: 32000  # NodePort端口(30000-32767范围内)
  selector:
    app.kubernetes.io/component: grafana
    app.kubernetes.io/name: grafana
    app.kubernetes.io/part-of: kube-prometheus


# kube-prometheus/manifests/prometheus-service.yaml
apiVersion: v1
kind: Service
metadata:
  labels:
    app.kubernetes.io/component: prometheus
    app.kubernetes.io/instance: k8s
    app.kubernetes.io/name: prometheus
    app.kubernetes.io/part-of: kube-prometheus
    app.kubernetes.io/version: 3.5.0
  name: prometheus-k8s
  namespace: monitoring
spec:
  type: NodePort  # 添加Service类型为NodePort
  ports:
  - name: web
    port: 9090    # 集群内部访问端口
    targetPort: web
    nodePort: 30900  # Web UI的NodePort端口
  - name: reloader-web
    port: 8080    # 集群内部访问端口
    targetPort: reloader-web
    nodePort: 30800  # Reloader的NodePort端口
  selector:
    app.kubernetes.io/component: prometheus
    app.kubernetes.io/instance: k8s
    app.kubernetes.io/name: prometheus
    app.kubernetes.io/part-of: kube-prometheus
  sessionAffinity: ClientIP


# kube-prometheus/manifests/alertmanager-service.yaml
apiVersion: v1
kind: Service
metadata:
  labels:
    app.kubernetes.io/component: alert-router
    app.kubernetes.io/instance: main
    app.kubernetes.io/name: alertmanager
    app.kubernetes.io/part-of: kube-prometheus
    app.kubernetes.io/version: 0.28.1
  name: alertmanager-main
  namespace: monitoring
spec:
  type: NodePort  # 添加Service类型为NodePort
  ports:
  - name: web
    port: 9093
    targetPort: web
  - name: reloader-web
    port: 8080
    targetPort: reloader-web
  selector:
    app.kubernetes.io/component: alert-router
    app.kubernetes.io/instance: main
    app.kubernetes.io/name: alertmanager
    app.kubernetes.io/part-of: kube-prometheus
  sessionAffinity: ClientIP


# 注意上述安装时资源的镜像来自于 `registry.k8s.io`,如果不能正常拉取,则可以将镜像替换成国内的
部署:
# 创建一个名为 `monitoring` 的命名空间,以及相关的 CRD 资源对象声明
kubectl apply --server-side -f kube-prometheus/manifests/setup

# 在原地等待这些资源上面的CRD资源处于可用状态,命令结果输出xxxxxxxxxxxxxxxxx condition met代表ok
kubectl wait \
	--for condition=Established \
	--all CustomResourceDefinition \
	--namespace=monitoring

# 部署各个组件
kubectl apply -f kube-prometheus/manifests/

# 如果在集群外使用 NodePort 访问不通,可能是网络限制的原因,删除 networkpolicy 即可,也可以自行修改网络限制允许集群外部访问
kubectl delete networkpolicy --all -n monitoring清理 Prometheus-Operator:
# 直接删除对应的资源清单即可
kubectl delete -f kube-prometheus/manifests/
kubectl delete -f kube-prometheus/manifests/setup查看:
$ kubectl get -n monitoring  pod
NAME                                  READY   STATUS    RESTARTS   AGE
alertmanager-main-0                   2/2     Running   0          44m
alertmanager-main-1                   2/2     Running   0          44m
alertmanager-main-2                   2/2     Running   0          44m
blackbox-exporter-d4d45d65-p7wx2      3/3     Running   0          55m
grafana-5cf499dffd-p8lsd              1/1     Running   0          55m
kube-state-metrics-6d8b8c455-67zb6    3/3     Running   0          55m
node-exporter-7r7vt                   2/2     Running   0          55m
node-exporter-m9plb                   2/2     Running   0          55m
node-exporter-s9gzc                   2/2     Running   0          55m
node-exporter-t5jlq                   2/2     Running   0          55m
node-exporter-vqw47                   2/2     Running   0          55m
prometheus-adapter-784f566c54-dv4wq   1/1     Running   0          55m
prometheus-adapter-784f566c54-jpcgh   1/1     Running   0          55m
prometheus-k8s-0                      2/2     Running   0          44m
prometheus-k8s-1                      2/2     Running   0          44m
prometheus-operator-f649bcd58-2j8zj   2/2     Running   0          55m
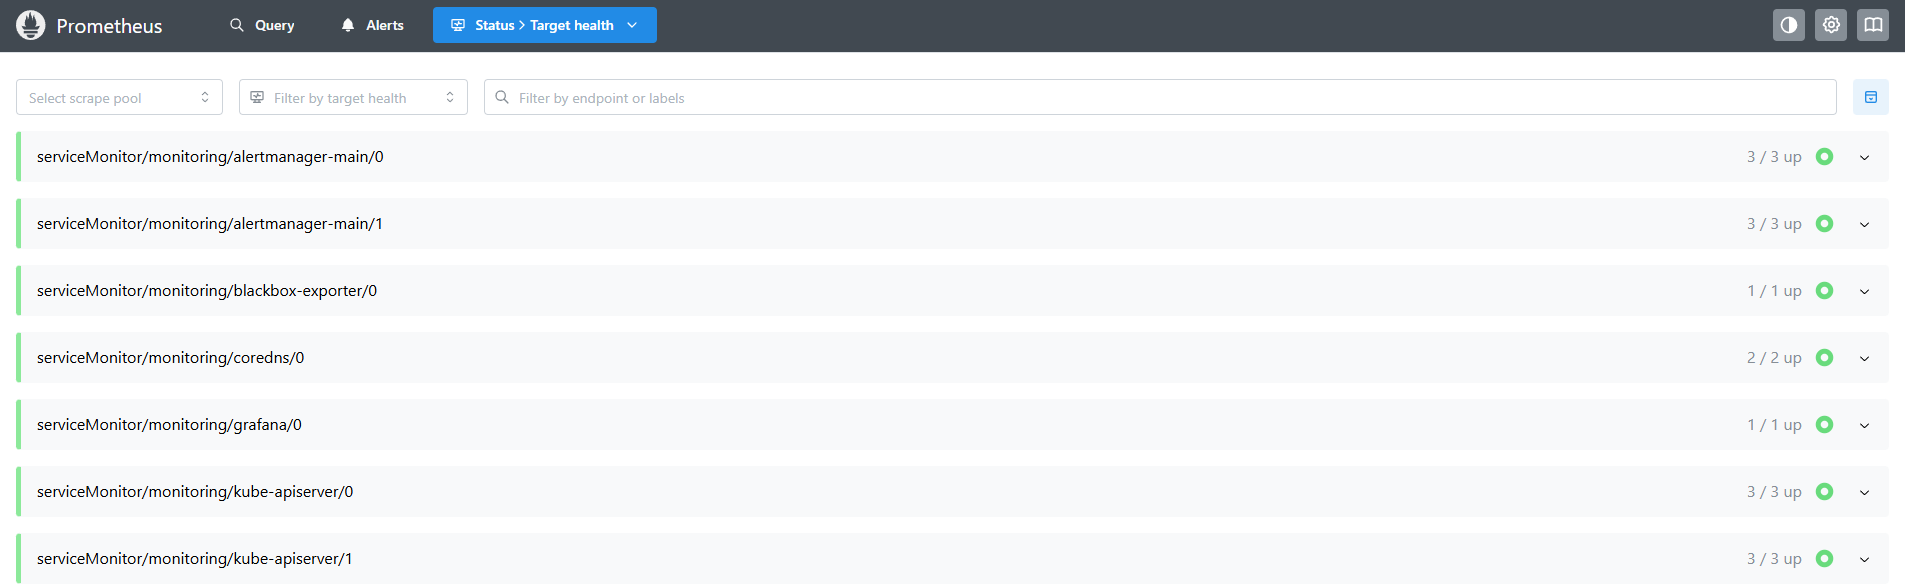
安装完 Prometheus Operator 之后,k8s 的节点和部分组件都默认被监控起来了,也就是说大多数服务都被监控起来了并且对接好了granfa 出图。可以通过 web 页面查看。
# grafana
http://192.168.2.151:32000/

# prometheus
http://192.168.2.151:30900/成功监控了部分服务:
同时有部分服务添加了监控项但是没有获取到目标:
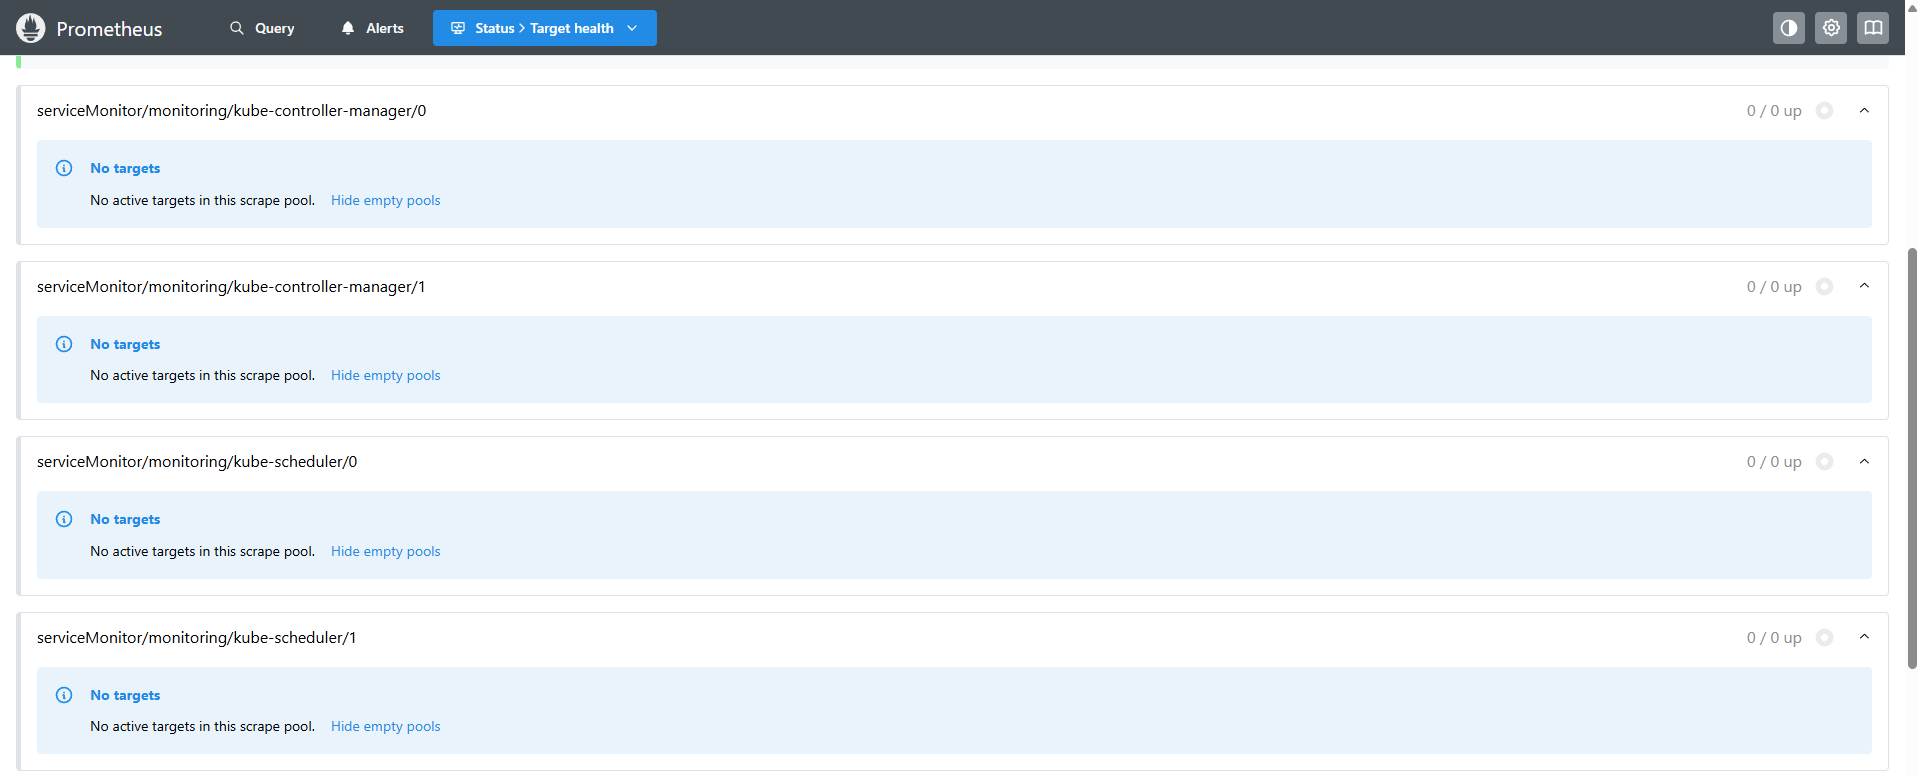
是因为 kube-prometheus 没有创建相应的 svc。
3. 自定义监控项
在 Prometheus Operator 中添加一个自定义的监控项非常简单:
- 被监控的目标要准备好一个拉取指标的接口,例如 /metrics。
- 可以是服务自带、也可以是安装的 exporter 提供的,该服务不一定要跑在 k8s中,只要是 endpoint 格式,http://ip:port 可访问即可。
- 创建一个 svc 来关联上面的 endpoint。
- 如果暴漏 /metrics 的服务是一个集群内的 Pod,那么创建的 svc 直接用标签选中即可。
- 如果暴漏 /metrics 的服务是一个集群外的服务,那么需要创建 svc+自定义 endpoint来关联。
- 添加监控对象:创建一个 ServiceMonitor 来选中 svc。
前面没有获取到目标的监控项就是因为只添加了 ServiceMonitor 而缺少 svc 来关联。
创建 kube-controller-manager 的 svc:
# prometheus-kube-controller-manager-service.yaml
apiVersion: v1
kind: Service
metadata:
  name: kube-controller-manager
  namespace: kube-system
  labels:
    app.kubernetes.io/managed-by: prometheus-operator
    app.kubernetes.io/name: kube-controller-manager
    k8s-app: kube-controller-manager
spec:
  # 该 svc 主要用来被 serviceMonitor 选中来监控的,不作任何其他用途使用所以可以设置为 Headless Service,不分配 ClusterIP。
  clusterIP: None
  ports:
  - name: https-metrics  # 主要指标端口,与ServiceMonitor中的port字段匹配
    port: 10257          # Service端口(kube-controller-manager默认的安全端口)
    protocol: TCP
    targetPort: 10257    # kube-controller-manager进程实际监听的端口
  sessionAffinity: None
  type: ClusterIP
  selector:
component: kube-controller-manager # 选择标签为 component: kube-controller-manager 的 Pod修改 kube-controller-manage 的监听地址:
# /etc/kubernetes/manifests/kube-controller-manager.yam
--bind-address=0.0.0.0 # 从 127.0.0.1 改为 0.0.0.0创建 kube-schedulerr 的 svc:
# prometheus-kube-scheduler-service.yaml
apiVersion: v1
kind: Service
metadata:
  name: kube-scheduler
  namespace: kube-system
  labels:
    app.kubernetes.io/managed-by: prometheus-operator
    app.kubernetes.io/name: kube-scheduler
    k8s-app: kube-scheduler
spec:
  clusterIP: None
  ports:
  - name: https-metrics  # 主要指标端口,与ServiceMonitor中的port字段匹配
    port: 10259          # Service端口(kube-scheduler默认的安全端口)
    protocol: TCP
    targetPort: 10259    # kube-scheduler进程实际监听的端口
  sessionAffinity: None
  type: ClusterIP
  selector:
component: kube-scheduler # 选择标签为 component: kube-scheduler 的 Pod修改 kube-scheduler 的监听地址:
# /etc/kubernetes/manifests/kube-scheduler.yam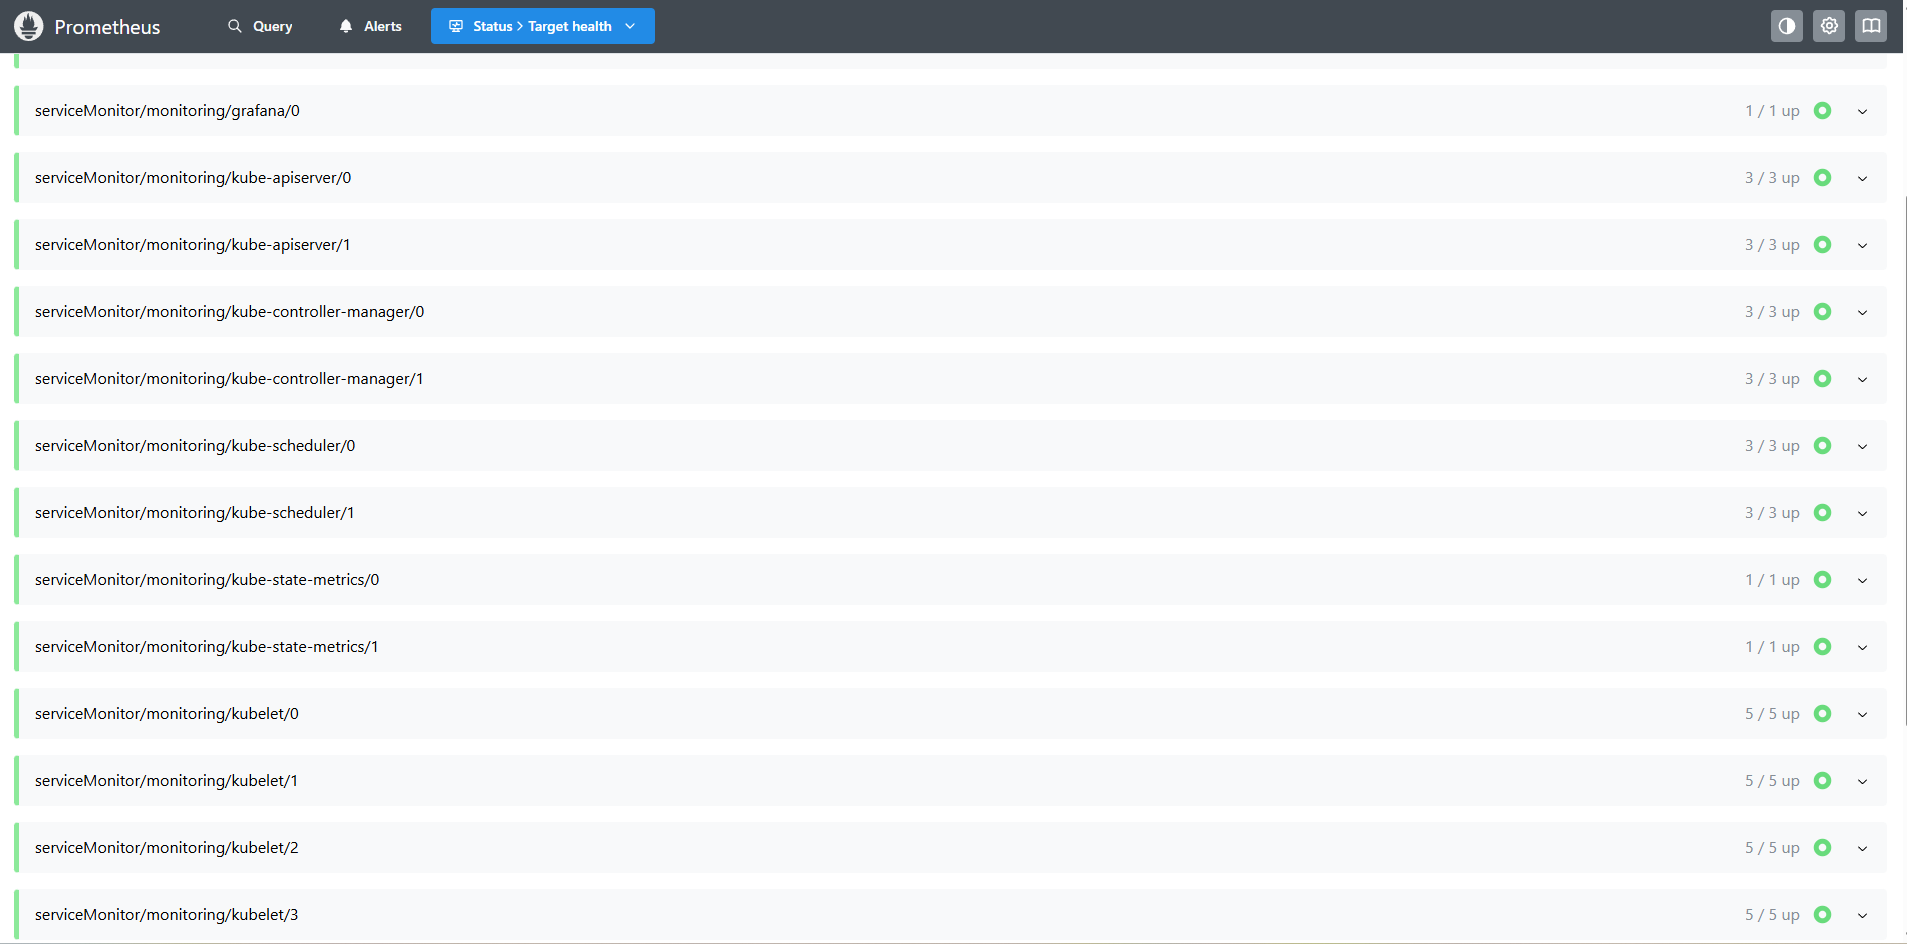
--bind-address=0.0.0.0 # 从 127.0.0.1 改为 0.0.0.0再次查看:
4. 自定义监控项完整示例
接下来通过添加 etcd 集群的监控来演示如何自定义监控项。
4.1. 先确认被监控应用对外暴漏了 /metrics 接口
etcd 自身就提供了 /metrics 接口,不用额外安装 exporter 了。但是端口监听在 127.0.0.1 上,需要改为 0.0.0.0,否则无法暴漏出来导致:connect: connection refused 错误。
在所有安装有 etcd 的 master 节点上修改,改完等一会会自动更新:
# /etc/kubernetes/manifests/etcd.yaml

# --listen-metrics-urls=http://127.0.0.1:2381 修改为
--listen-metrics-urls=http://0.0.0.0:2381 4.2. 添加 svc 来关联 etcd
因为我们这里是把 etcd 当成独立于集群之外的服务,直接用 ip:port 来关联的,所以下面我们的 svc 并没有定义一个 selector 选择器来选中相关 pod,也正因为没有用标签选择器去选中pod,所以我们需要自定义 endpoint 来找到被 svc 关联的应用。
# prometheus-etcd-service.yaml
apiVersion: v1
kind: Service
metadata:
  name: etcd-k8s
  namespace: kube-system
  labels:
    k8s-app: etcd  # 这里的标签就是为 serviceMonitor 准备的,一会 serviceMonitor 就用该标签来选中它
spec:
  type: ClusterIP
  clusterIP: None
  ports:
  - name: port
    port: 2381
---
apiVersion: v1
kind: Endpoints
metadata:
  name: etcd-k8s
  namespace: kube-system
  labels:
    k8s-app: etcd  # 这里的标签必须要与svc的保持一致
subsets:
- addresses:
  - ip: 192.168.2.151  # 指定etcd节点地址
  - ip: 192.168.2.152
  - ip: 192.168.2.153
  ports:
  - name: port
port: 23814.3. 添加 serviceMonitor 来选中上面的 svc
# kubernetesControlPlane-serviceMonitorEtcd.yaml
apiVersion: monitoring.coreos.com/v1
kind: ServiceMonitor
metadata:
  name: etcd-k8s
  namespace: monitoring
  labels:
    k8s-app: etcd-k8s
spec:
  jobLabel: k8s-app
  endpoints:
  - port: port
    interval: 15s   # 每15秒抓取一次指标数据
  selector:
    matchLabels:
      k8s-app: etcd   # 选中svc
  namespaceSelector:  # 选中名称空间
    matchNames: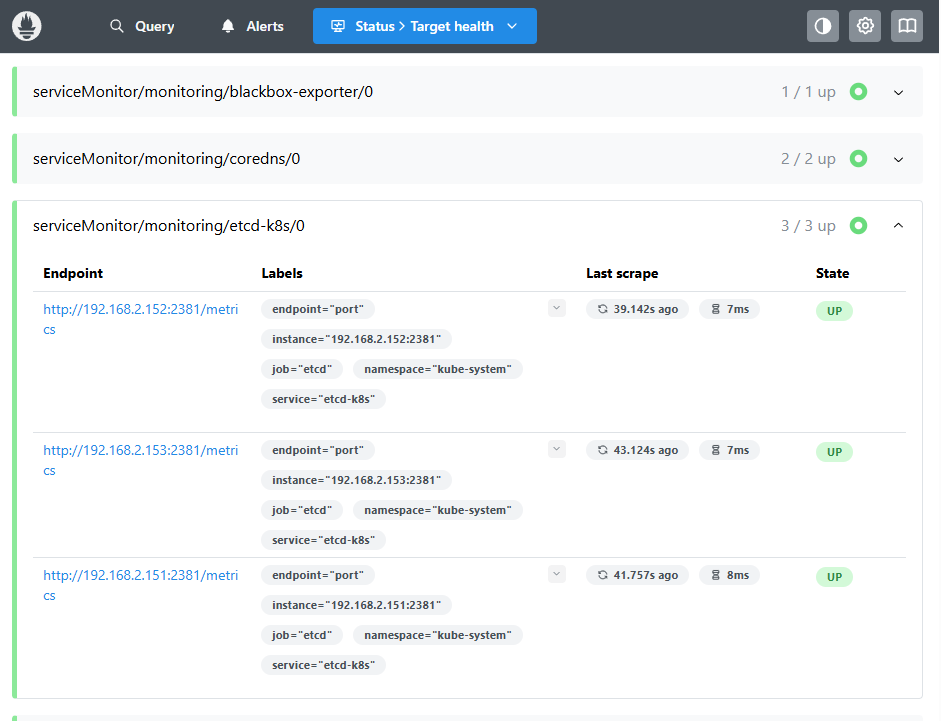
- kube-system在 prometheus web 页面查看:
5. 配置 grafana 出图
登录 web 页面:
# 默认登录信息
# 用户名:admin
# 密码:admin可以看到有很多 kube-prometheus 已经为我们准备好的 Dashboard:
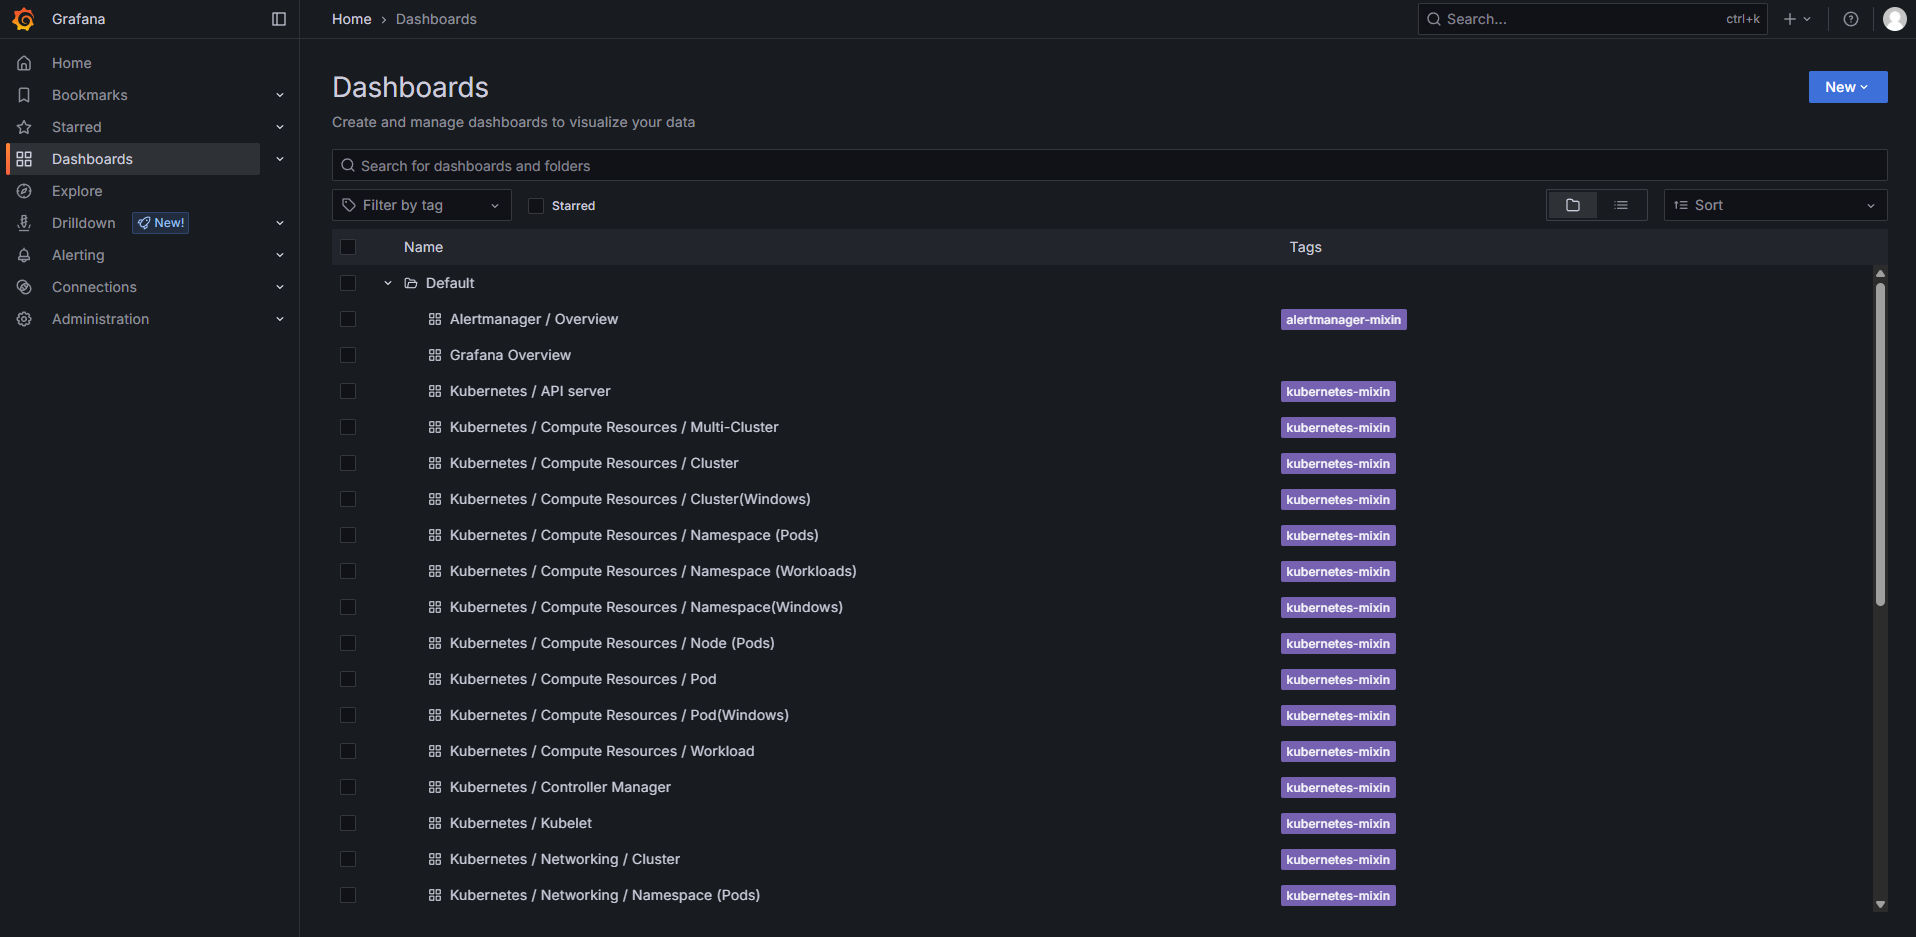
我们选择 Node Exporter/Nodes 的 Dashboard 进去查看:

可以看到节点信息。
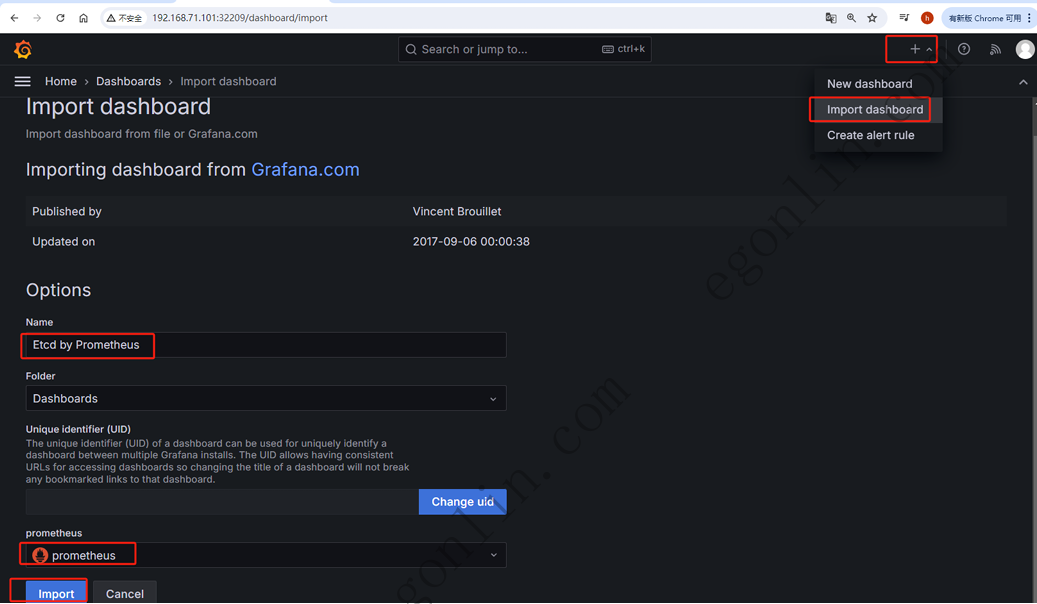
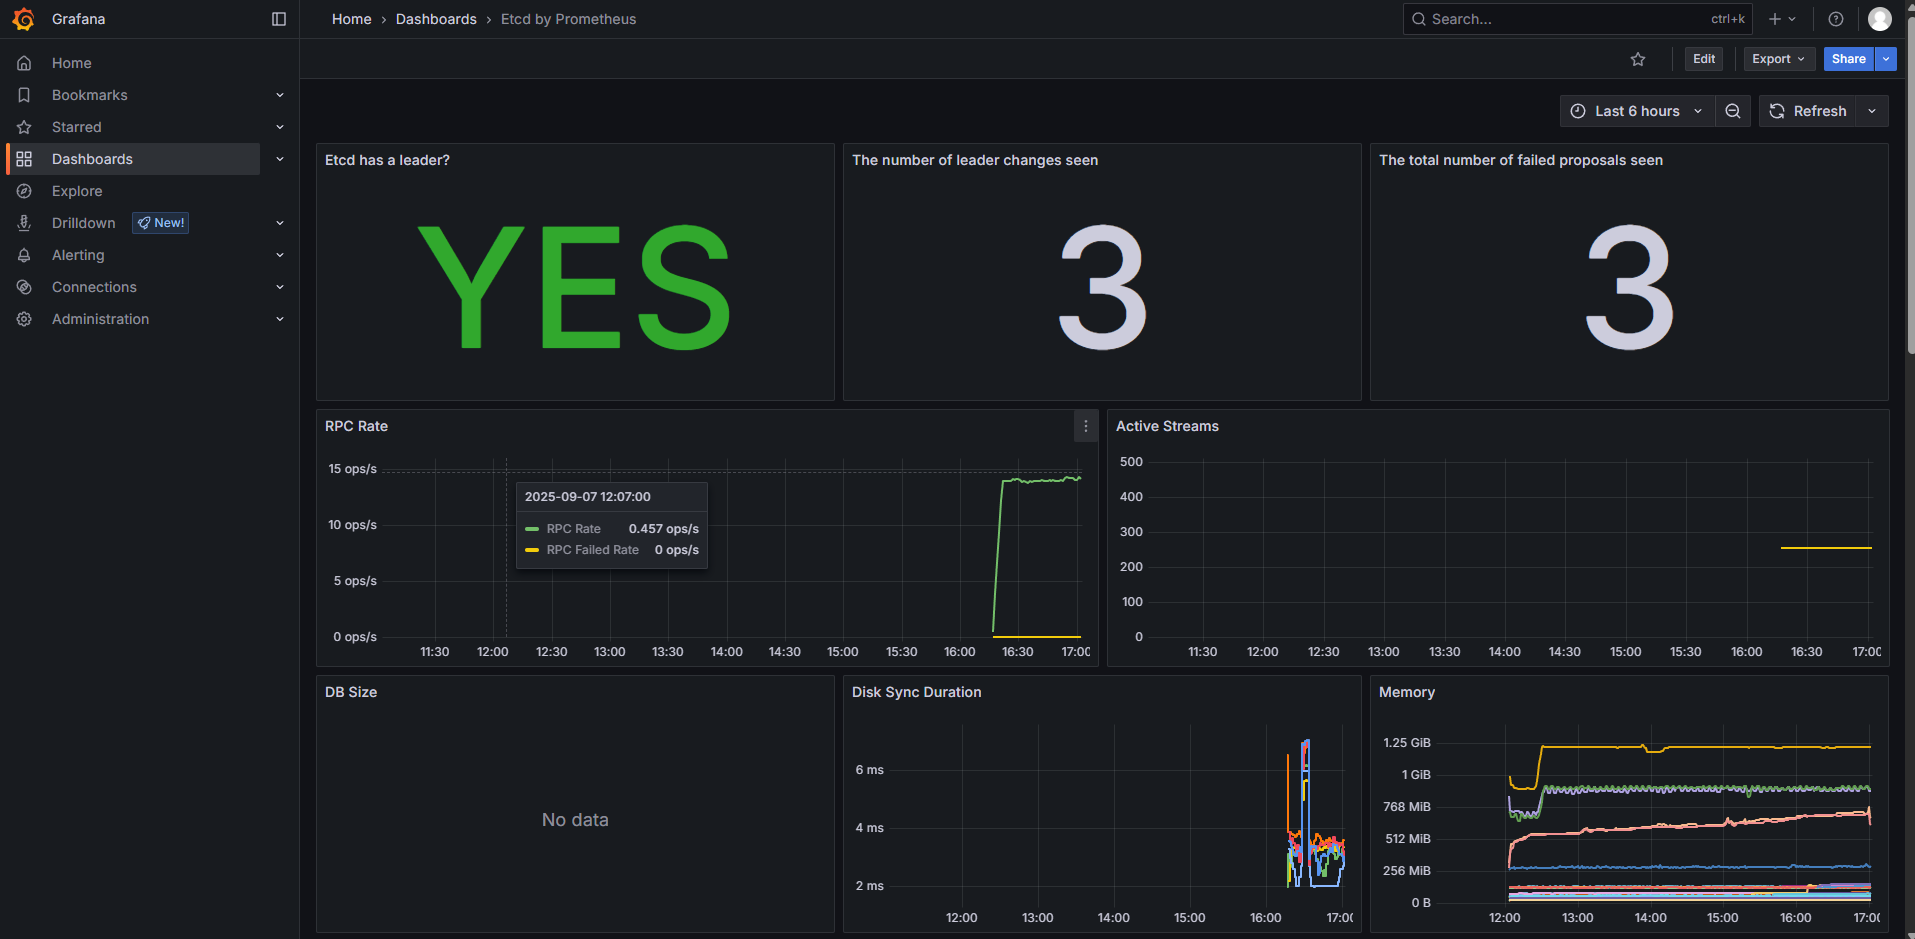
还可以导入其他模版:
导入一个 etcd 监控模版:3070
6. 配置报警
我们去查看 Prometheus Dashboard 的 Alert 页面下面就已经有很多报警规则了,这一系列的规则其实都来自于项目 https://github.com/kubernetes-monitoring/kubernetes-mixin,我们都通过 Prometheus Operator 安装配置上了。
在我们自己配置报警规则前,先来捋一下之前部署的报警规则整条配置链路。
6.1. Prometheus Server 和 AlertManager 组件的关联
查看 Prometheus Server 的配置,因为配置是放在 secret 资源内的所以无法直接查看,有两种方式可以查看:
# 方式一:进入容器
kubectl  -n monitoring exec -ti prometheus-k8s-0 sh

/prometheus $ vi /etc/prometheus/config_out/prometheus.env.yaml

# 方式二:浏览器访问:http://192.168.2.151:30900/config
# 或者 Status-----》Configuration
Prometheus 对接 AlertManager 配置:
alerting:
  alert_relabel_configs:
  - separator: ;
    regex: prometheus_replica
    replacement: $1
    action: labeldrop
  alertmanagers:
  - follow_redirects: true
    enable_http2: true
    scheme: http
    path_prefix: /
    timeout: 10s
    api_version: v2
    relabel_configs:
    - source_labels: [__meta_kubernetes_service_name]
      separator: ;
      regex: alertmanager-main
      replacement: $1
      action: keep
    - source_labels: [__meta_kubernetes_endpoint_port_name]
      separator: ;
      regex: web
      replacement: $1
      action: keep
    kubernetes_sd_configs:
    - role: endpoints
      kubeconfig_file: ""
      follow_redirects: true
      enable_http2: true
      namespaces:
        own_namespace: false
        names:
- monitoringPrometheus Server 的报警规则路径:
rule_files:
- /etc/prometheus/rules/prometheus-k8s-rulefiles-0/*.yaml
进入 pod 内查看报警规则:
kubectl -n monitoring exec -ti prometheus-k8s-0 -- sh

/prometheus $
/prometheus $ cd /etc/prometheus/rules/prometheus-k8s-rulefiles-0/
/etc/prometheus/rules/prometheus-k8s-rulefiles-0 $ ls
monitoring-alertmanager-main-rules-0b321538-43c0-43d8-9c06-72a0c58353ab.yaml
monitoring-grafana-rules-b0ffa398-247c-4d8f-87d7-da068a1df20a.yaml
monitoring-kube-prometheus-rules-fd6ae2b5-7d86-46c6-815e-b98064029d2b.yaml
monitoring-kube-state-metrics-rules-9082261e-a2af-4673-9c1f-d4e8795742ec.yaml
monitoring-kubernetes-monitoring-rules-cb633ccf-3451-4395-944d-794aa2158c87.yaml
monitoring-node-exporter-rules-f03b5d87-3612-47ab-b6af-de1f472a9829.yaml
monitoring-prometheus-k8s-prometheus-rules-f6746aa9-27f6-4593-9927-8800c59a1d5b.yaml
monitoring-prometheus-operator-rules-1c72d722-7a34-4e29-bb0f-4ae409800825.yaml上面的报警规则就是通过 PrometheusRule 资源创建的:
$ kubectl -n monitoring get prometheusrules
NAME                              AGE
alertmanager-main-rules           5h48m
grafana-rules                     5h48m
kube-prometheus-rules             5h48m
kube-state-metrics-rules          5h48m
kubernetes-monitoring-rules       5h48m
node-exporter-rules               5h48m
prometheus-k8s-prometheus-rules   5h48m
prometheus-operator-rules         5h48m
综上,要添加一个报警项,添加一个 PrometheusRule 资源就行。
如下创建一个 etcd 的报警规则,不可用 etcd 数超过一半就触发报警:
# prometheus-etcdRules.yaml
apiVersion: monitoring.coreos.com/v1
kind: PrometheusRule
metadata:
  # 注释:不必加该标签,除非你Prometheus资源里设置了专门的ruleSelector标签
  # labels:
  #   prometheus: k8s
  #   role: alert-rules
  name: etcd-rules
  namespace: monitoring
spec:
  groups:
  - name: etcd
    rules:
    - alert: EtcdClusterUnavailable
      annotations:
        summary: etcd cluster small
        description: If one more etcd peer goes down the cluster will be unavailable
      expr: |
        count(up{job="etcd"} == 0) > ceil(count(up{job="etcd"}) / 2)
      # for: 3m
      for: 1m
      labels:
        severity: critical


up{job="etcd"} == 0        # 等于0代表挂掉了,等于1代表正常
count(up{job="etcd"}       # 不做任何0或1的判断则代表取出所有etcd实例,包括挂掉的和没挂掉的
count(up{job="etcd"}) / 2  # 这里的除法运算得到的是小数
ceil() # 向上取整 总结:
- Prometheus Server 职责
- 数据采集: 从各种 target 抓取指标数据
- 规则评估: 根据 alerting_rules 定期评估条件
- 告警生成: 当条件满足时生成告警对象
- 告警推送: 将告警发送到 Alertmanager
- Alertmanager 职责
- 告警接收: 接收来自 Prometheus 的告警
- 去重分组: 对相似告警进行分组和去重
- 静默抑制: 处理静默规则和告警抑制
- 通知路由: 根据路由规则发送到不同渠道
6.2. Prometheus 报警信息生命周期
一个报警信息在生命周期内有下面 3 种状态:
- Pending:当某个监控指标触发了告警表达式的条件,但还没有持续足够长的时间,即没有超过
for阈值设定的时间,这个告警状态被标记为pending。 - Firing:当某个监控指标触发了告警条件并且持续超过了设定的
for时间,告警将由pending状态改成firing。 - Inactive:当某个监控指标不再满足告警条件或者告警从未被触发时,这个告警状态被标记为
inactive。
6.3. 优化报警信息(针对报警杂乱且频繁)
- prometheus server 里的报警规则设置
- 判定报警:不要超过阈值就立即报警,而是应该在达到阈值之后持续一段时间再出发报警。
- 优化阈值:设置合理的阈值。
- alertmanager 支持的配置
- 去重分组:对相似告警进行分组和去重。
- 静默:让一些监控报警在我们设定的时间内哑火,不要让其一直发报警。
- 在处理已知问题或维护期间,频繁触发并发送的报警信息十分烦人,可以对该报警进行静默设置。
- 在 alertmanager 的管理界面设置。
- 抑制:某个告警触发后,与其相关的一些报警可能伴随着一齐触发,比如节点宕机了,会触发节点宕机的报警,该节点上的服务也都挂掉了也会触发一系列这些服务的故障报警,然而根因是节点宕机了,所以那些随之产生的报警项是无用的、烦人的、干扰项,应该加以抑制。
- 设置抑制避免告警风暴。
- 在 alertmanager 的配置文件中设置。
- 定制报警信息模版:格式统一便于识别。
- 在 alertmanager 的配置中定制报警信息模版。
7. alertmanager 对接钉钉
7.1. 准备告警示例
先刻意让 PrometheusRule 的条件触发,我们的 etcd 实例共有3个,为了测试报警通知,我们这里刻意让其触发报警。
# prometheus-etcdRules.yaml
apiVersion: monitoring.coreos.com/v1
kind: PrometheusRule
metadata:
 # labels: # 不必加该标签,除非你Prometheus资源里设置了专门的ruleSelector标签
  name: etcd-rules
  namespace: monitoring
spec:
  groups:
  - name: etcd
    rules:
    - alert: EtcdClusterUnavailable
      annotations:
        summary: etcd cluster small
        description: If one more etcd peer goes down the cluster will be unavailable
      expr: |
         count(up{job="etcd"}) > 1  # etcd实例总数大于1就触发报警
      for: 1m
      labels:
        # severity: critical
        # 我们之前的报警信息打上了标签 severity: critical,而自带的 prometheusRule 中有一些报警也打上了这个标签,为了避免冲突(匹配到带有相同标签的报警信息,一些自带的 route 设置有 continue:false 就会导致报警通知收不到),我们还是更新成自己独一无二的标签。
        # continue: false 在 Alertmanager 路由配置中是一个非常重要的控制参数,它决定了告警的匹配行为。
        # 首次匹配即停止:告警匹配到第一个符合的路由后,不再继续检查后续路由。
etcdwarning: critical过一会后发生报警,报警信息都被打上了标签 etcdwarning=critical,一会 altermanager 中就用该标签来选中该报警信息。
7.2. 准备钉钉工具
- 钉钉下载
- 添加群聊(至少2个人才能拉群)
- 在群里中添加机器人
- 安全设置选择加签
- 获得密钥:SEC90fa372c21b4a112708c27a2dae2bf249e06560391cdf133b16df4c3d5b13839
- Webhook:https://oapi.dingtalk.com/robot/send?access_token=777c8d928824d674e41eb1ec5d27f70ec3faf184ec95bcdde3cf7601bf679e68
7.3. 部署钉钉的 webhook 软件
# promoter-conf.yaml
apiVersion: v1
kind: ConfigMap
metadata:
name: promoter-conf
namespace: monitoring
data:
# 一、告警内容模版
template.tmpl: |-
{{ define "default.tmpl" }}
{{- if gt (len .Alerts.Firing) 0 -}}
{{- range $index, $alert := .Alerts -}}
============ = **<font color='#FF0000'>告警</font>** = =============

**Egon test**
**告警名称:** {{ $alert.Labels.alertname }}
**告警级别:** {{ $alert.Labels.severity }}
**告警状态:** {{ .Status }}
**告警实例:** {{ $alert.Labels.instance }} {{ $alert.Labels.device }}
**告警概要:** {{ .Annotations.summary }}
**告警详情:** {{ $alert.Annotations.message }}{{ $alert.Annotations.description }}
**故障时间:** {{ ($alert.StartsAt.Add 28800e9).Format "2006-01-02 15:04:05" }}
============ = end = =============
{{- end }}
{{- end }}
{{- if gt (len .Alerts.Resolved) 0 -}}
{{- range $index, $alert := .Alerts -}}
============ = <font color='#00FF00'>恢复</font> = =============
**告警实例:** {{ .Labels.instance }}
**告警名称:** {{ .Labels.alertname }}
**告警级别:** {{ $alert.Labels.severity }} 级
**告警状态:** {{ .Status }}
**告警概要:** {{ $alert.Annotations.summary }}
**告警详情:** {{ $alert.Annotations.message }}{{ $alert.Annotations.description }}
**故障时间:** {{ ($alert.StartsAt.Add 28800e9).Format "2006-01-02 15:04:05" }}
**恢复时间:** {{ ($alert.EndsAt.Add 28800e9).Format "2006-01-02 15:04:05" }}
============ = **end** = =============
{{- end }}
{{- end }}
{{- end }}
# 二、该webhook服务的配置文件
config.yaml: |-
# 引用模版路径/etc/template.tmpl,template.tmpl会固定挂载到pod的/etc/promoter目录下
templates:
- /etc/promoter/template.tmpl
targets:
webhook1:
url: https://oapi.dingtalk.com/robot/send?access_token=777c8d928824d674e41eb1ec5d27f70ec3faf284ec95bcdde3cf7601bf679e68
secret: SEC90fa372c21b4a112708c27a2dae2bf249e06560391cdf133b16df4c3d5b13839
message:
text: |
{{ template "default.tmpl" . }}
@17769748307 @18048057387
mention:
mobiles: ['17769748307','18048057387']
---
apiVersion: apps/v1
kind: Deployment
metadata:
name: promoter
namespace: monitoring
labels:
app: promoter
spec:
selector:
matchLabels:
app: promoter
template:
metadata:
labels:
app: promoter
spec:
volumes:
- name: promotercfg
configMap:
name: promoter-conf
containers:
- name: promoter
image: timonwong/prometheus-webhook-dingtalk:latest
imagePullPolicy: IfNotPresent
args:
- --web.listen-address=:8060
- --config.file=/etc/promoter/config.yaml
ports:
- containerPort: 8060
volumeMounts:
- mountPath: /etc/promoter
name: promotercfg
resources:
limits:
memory: "128Mi"
cpu: "100m"
requests:
memory: "64Mi"
cpu: "50m"
---
apiVersion: v1
kind: Service
metadata:
name: promoter
namespace: monitoring
labels:
app: promoter
spec:
selector:
app: promoter
ports:
- name: http
port: 8080
targetPort: 8060
protocol: TCP
type: ClusterIP
7.4. 配置报警通知
接下来我们来配置 altertmanager,对接上面的 webhook。
直接修改一下 altermanager 的配置的原始 yaml 文件,然后重新部署一下。
# kube-prometheus/manifests/alertmanager-secret.yaml
apiVersion: v1
kind: Secret
metadata:
  labels:
    app.kubernetes.io/component: alert-router
    app.kubernetes.io/instance: main
    app.kubernetes.io/name: alertmanager
    app.kubernetes.io/part-of: kube-prometheus
    app.kubernetes.io/version: 0.27.0
  name: alertmanager-main
  namespace: monitoring
stringData:
  alertmanager.yaml: |
    global:
      resolve_timeout: 5m

    inhibit_rules:
    - equal:
      - namespace
      - alertname
      source_matchers:
      - severity = critical
      target_matchers:
      - severity =~ warning|info

    - equal:
      - namespace
      - alertname
      source_matchers:
      - severity = warning
      target_matchers:
      - severity = info

    - equal:
      - namespace
      source_matchers:
      - alertname = InfoInhibitor
      target_matchers:
      - severity = info

    # 第一处修改,接收器配置
    receivers:
    - name: mywebhook
      webhook_configs:
      - url: http://promoter.monitoring:8080/dingtalk/webhook1/send
        send_resolved: true

    # 第二处修改,路由配置
    route:
      group_interval: 1m
      group_wait: 30s
      receiver: mywebhook     # 这个根路由会接收所有告警!
      repeat_interval: 1m
      routes:
      - matchers:
        - etcdwarning = critical
        receiver: mywebhook
        continue: true
type: Opaque查看 altermanager 的配置:
# 1、可以看配置源文件:vim kube-prometheus/manifests/alertmanager-secret.yaml
# 2、也可以在页面中访问:http://nodeIp:NodePort/#/status
# 3、也可以用命令查看:
kubectl get secret alertmanager-main-generated -n monitoring -o json | jq -r '.data."alertmanager.yaml.gz"' | base64 -d | gzip -d8. 配置服务自动发现
有了 serviceMornitor 之后,添加监控项非常方便,但是针对大量重复性的监控项,再去一个个的创建 serviceMornitor 去完成监控项的添加依然比较麻烦。
Prometheus 实现服务自动发现配置如下:
# prometheus-additional.yaml
- job_name: 'myendpoints'
  kubernetes_sd_configs:
    - role: endpoints    # 发现所有 endpoints
  relabel_configs:
    # 第一条规则 - 过滤采集目标
    # 作用: 只保留带有 prometheus.io/scrape=true 注解的Service
    # 原理: 检查Service的注解,如果值为"true"则保留该目标
    - source_labels: [__meta_kubernetes_service_annotation_prometheus_io_scrape]
      action: keep
      regex: true

    # 第二条规则 - 自定义指标路径
    # 作用: 使用Service注解 prometheus.io/path 的值作为指标采集路径
    # 默认: 如果没有此注解,使用默认的 /metrics 路径
    - source_labels: [__meta_kubernetes_service_annotation_prometheus_io_path]
      action: replace
      target_label: __metrics_path__
      regex: (.+)

    # 第三条规则 - 端口配置
    # 作用: 组合地址和端口号
    # 正则解释:
    ## ([^:]+) - 匹配主机名或IP(不包含冒号)
    ## (?::\d+)? - 可选匹配现有的端口号
    ## ;(\d+) - 匹配注解中指定的端口号
    # 示例: 如果地址是 10.0.0.1:8080,端口注解是 9090,结果变为 10.0.0.1:9090
    - source_labels: [__address__, __meta_kubernetes_service_annotation_prometheus_io_port]
      action: replace
      target_label: __address__
      regex: ([^:]+)(?::\d+)?;(\d+)
      replacement: $1:$2

    # 第四条规则 - 协议配置
    # 作用: 设置采集协议(http或https)
    # 默认: 如果没有注解,默认使用http
    - source_labels: [__meta_kubernetes_service_annotation_prometheus_io_scheme]
      action: replace
      target_label: __scheme__
      regex: (https?)

    # 第五条规则 - 标签映射
    # 作用: 将Service的所有标签添加到监控指标中
    - action: labelmap
      regex: __meta_kubernetes_service_label_(.+)

    # 第六条规则 - 命名空间标签
    # 作用: 添加命名空间信息作为标签
    - source_labels: [__meta_kubernetes_namespace]
      action: replace
      target_label: kubernetes_namespace

    # 第七至九条规则 - 其他元数据标签
    # 作用: 分别添加Service名称、Pod名称和Node名称作为标签
    - source_labels: [__meta_kubernetes_service_name]
      action: replace
      target_label: kubernetes_service
    - source_labels: [__meta_kubernetes_pod_name]
      action: replace
      target_label: kubernetes_pod
    - source_labels: [__meta_kubernetes_node_name]
      action: replace
target_label: kubernetes_node使用示例:
# 在Service上添加注解,这样配置后,Prometheus会自动发现并监控所有带有相应注解的Service背后的Pod。
apiVersion: v1
kind: Service
metadata:
  name: my-service
  annotations:
    prometheus.io/scrape: "true"
    prometheus.io/port: "8080"
    prometheus.io/path: "/metrics"
    prometheus.io/scheme: "http"
spec:
  selector:
    app: my-app
  ports:
    - port: 80
targetPort: 8080如何把上面的配置注入到 Prometheus Server 的配置中呢?
把上面的内容创建成一个 secret 资源:
kubectl create secret generic additional-configs --from-file=prometheus-additional.yaml -n monitoring
修改并提交 prometheus 资源的变更:
# kube-prometheus/manifests/prometheus-prometheus.yaml
apiVersion: monitoring.coreos.com/v1
kind: Prometheus
metadata:
  labels:
    app.kubernetes.io/component: prometheus
    app.kubernetes.io/instance: k8s
    app.kubernetes.io/name: prometheus
    app.kubernetes.io/part-of: kube-prometheus
    app.kubernetes.io/version: 3.4.0
  name: k8s
  namespace: monitoring
spec:
  alerting:
    alertmanagers:
    - apiVersion: v2
      name: alertmanager-main
      namespace: monitoring
      port: web
  enableFeatures: []
  externalLabels: {}
  image: quay.io/prometheus/prometheus:v3.4.0
  nodeSelector:
    kubernetes.io/os: linux
  podMetadata:
    labels:
      app.kubernetes.io/component: prometheus
      app.kubernetes.io/instance: k8s
      app.kubernetes.io/name: prometheus
      app.kubernetes.io/part-of: kube-prometheus
      app.kubernetes.io/version: 3.4.0
  podMonitorNamespaceSelector: {}
  podMonitorSelector: {}
  probeNamespaceSelector: {}
  probeSelector: {}
  replicas: 2
  resources:
    requests:
      memory: 400Mi
  ruleNamespaceSelector: {}
  ruleSelector: {}
  scrapeConfigNamespaceSelector: {}
  scrapeConfigSelector: {}
  securityContext:
    fsGroup: 2000
    runAsNonRoot: true
    runAsUser: 1000
  serviceAccountName: prometheus-k8s
  serviceMonitorNamespaceSelector: {}
  serviceMonitorSelector: {}
  version: 3.4.0
  # 增加这一段配置
  additionalScrapeConfigs:
    # 这里 name 对应的就是上面创建的 secret 的名字
    name: additional-configs
key: prometheus-additional.yaml为 prometheus 添加权限:
# kube-prometheus/manifests/prometheus-clusterRole.yaml
apiVersion: rbac.authorization.k8s.io/v1
kind: ClusterRole
metadata:
  labels:
    app.kubernetes.io/component: prometheus
    app.kubernetes.io/instance: k8s
    app.kubernetes.io/name: prometheus
    app.kubernetes.io/part-of: kube-prometheus
    app.kubernetes.io/version: 3.4.0
  name: prometheus-k8s
rules:
- apiGroups:
  - ""
  resources:
  - nodes/metrics
  verbs:
  - get
- nonResourceURLs:
  - /metrics
  - /metrics/slis
  verbs:
  - get
# 添加权限
- apiGroups:
  - ""
  resources:
  - nodes
  - services
  - endpoints
  - pods
  - nodes/proxy
  verbs:
  - get
  - list
  - watch
9. 数据持久化
具体指的是 prometheus-k8s-n(运行着 Prometheus Server 服务)这个 Pod 的数据持久化。主要是 Prometheus 采集到的监控数据。
因为 Prometheus Operator 实际是使用 statefulset 管理 prometheus 的,所以我们这里通过 StorageClass 来做数据持久化,此外由于 Prometheus 本身对 NFS 存储没有做相关的支持,所以线上一定不要用 NFS 来做数据持久化。
$ kubectl get -n monitoring statefulsets.apps prometheus-k8s -o yaml

# 可以看到使用的是临时存储
    volumes:
      - name: config
        secret:
          defaultMode: 420
          secretName: prometheus-k8s
      - name: tls-assets
        projected:
          defaultMode: 420
          sources:
          - secret:
              name: prometheus-k8s-tls-assets-0
      - emptyDir:
          medium: Memory
        name: config-out
      - configMap:
          defaultMode: 420
          name: prometheus-k8s-rulefiles-0
        name: prometheus-k8s-rulefiles-0
      - name: web-config
        secret:
          defaultMode: 420
          secretName: prometheus-k8s-web-config
      - emptyDir: {}
name: prometheus-k8s-db还是通过修改 prometheus 资源来完成变更:
# kube-prometheus/manifests/prometheus-prometheus.yaml

spec:
  ......
  # 末尾添加这一段配置
  # 存储配置
  storage:
    volumeClaimTemplate:
      spec:
        storageClassName: cfs-sc  # 根据自己的环境选择 StorageClass
        accessModes: ["ReadWriteOnce"]
        resources:
          requests:
            storage: 10Gi
部署后再查看:
$ kubectl get -n monitoring statefulsets.apps prometheus-k8s -o yaml

...
volumeClaimTemplates:
  - apiVersion: v1
    kind: PersistentVolumeClaim
    metadata:
      creationTimestamp: null
      name: prometheus-k8s-db
    spec:
      accessModes:
      - ReadWriteOnce
      resources:
        requests:
          storage: 10Gi
      storageClassName: cfs-sc
volumeMode: Filesystem10. 实现黑盒监控
黑盒监控:以用户的身份测试服务的外部可见性。
所以要实现黑盒监控需要有一个客户端程序(模拟用户)可以朝着指定的服务发起访问请求,来判断服务是否可用,Prometheus 社区提供了一个 Blackbox exporter 程序用来模拟用户来发起访问测试。
我们安装 kube-prometheus 项目时这个程序已经一并部署好了,如过是自建的 prometheus 监控系统,可以通过 helm 部署 Blackbox exporter。
10.1. Helm 部署 Blackbox exporter
 # 添加官方仓库
 helm repo add prometheus-community https://prometheus-community.github.io/helm-charts
 helm repo update

 # 下载&解压
 helm pull prometheus-community/prometheus-blackbox-exporter --untar
修改 values.yaml:
config:
	modules:
	  http_2xx:  # http 检测模块 Blockbox-Exporter 中所有的探针均是以 Module 的信息进行配置
	    prober: http
	    timeout: 10s
	    http:
	      valid_http_versions: ["HTTP/1.1", "HTTP/2"]
	      valid_status_codes: [200]  # 默认 2xx,这里定义一个返回状态码,在grafana作图时,有明示。
	      method: GET
	      headers:
	        Host: prometheus.example.com
	        Accept-Language: en-US
	        Origin: example.com
	      preferred_ip_protocol: "ip4" # 首选IP协议
	      no_follow_redirects: false # 关闭跟随重定向

	  http_post_2xx: # http post 监测模块
	    prober: http
	    timeout: 10s
	    http:
	      valid_http_versions: ["HTTP/1.1", "HTTP/2"]
	      method: POST
	      # post 请求headers, body 这里可以不声明
	      headers:  # 使用 json 格式
	        Content-Type: application/json
	      body: '{"text": "hello"}'
	      preferred_ip_protocol: "ip4"

	  tcp_connect:  # TCP 检测模块
	    prober: tcp
	    timeout: 10s

	  dns_tcp:  # DNS 通过TCP检测模块
	    prober: dns
	    dns:
	      transport_protocol: "udp"  # 默认是 udp
	      preferred_ip_protocol: "ip4"  # 默认是 ip6
	      query_name: "kubernetes.default.svc.cluster.local" # 利用这个域名来检查 dns 服务器
	      # query_type: "A"  # 如果是 kube-dns ,一定要加入这个,因为不支持Ipv6
部署 Blackbox-Exporter:
helm install blackbox-exporter -n monitoring .
查看 kube-prometheus 自动部署的 Blackbox-Exporte:
$ kubectl -n monitoring get pod blackbox-exporter-d4d45d65-6w47b
NAME                               READY   STATUS    RESTARTS        AGE
blackbox-exporter-d4d45d65-6w47b   3/3     Running   3 (6h12m ago)   28h


$ kubectl -n monitoring get svc blackbox-exporter
NAME                TYPE        CLUSTER-IP     EXTERNAL-IP   PORT(S)              AGE
blackbox-exporter   ClusterIP   10.108.32.41   <none>        9115/TCP,19115/TCP   28h

# 9115/TCP - 这是Blackbox Exporter的默认管理/metrics端口
## 提供Blackbox Exporter自身的metrics指标,用于监控Blackbox Exporter本身的运行状态

# 19115/TCP - 这是Blackbox Exporter的探测功能端口
查看配置模块信息:
# kubectl -n monitoring get cm blackbox-exporter-configuration -o yaml
apiVersion: v1
data:
  config.yml: |-
    "modules":
      "http_2xx":
        "http":
          "preferred_ip_protocol": "ip4"
        "prober": "http"
      "http_post_2xx":
        "http":
          "method": "POST"
          "preferred_ip_protocol": "ip4"
        "prober": "http"
      "irc_banner":
        "prober": "tcp"
        "tcp":
          "preferred_ip_protocol": "ip4"
          "query_response":
          - "send": "NICK prober"
          - "send": "USER prober prober prober :prober"
          - "expect": "PING :([^ ]+)"
            "send": "PONG ${1}"
          - "expect": "^:[^ ]+ 001"
      "pop3s_banner":
        "prober": "tcp"
        "tcp":
          "preferred_ip_protocol": "ip4"
          "query_response":
          - "expect": "^+OK"
          "tls": true
          "tls_config":
            "insecure_skip_verify": false
      "ssh_banner":
        "prober": "tcp"
        "tcp":
          "preferred_ip_protocol": "ip4"
          "query_response":
          - "expect": "^SSH-2.0-"
      "tcp_connect":
        "prober": "tcp"
        "tcp":
          "preferred_ip_protocol": "ip4"
kind: ConfigMap
metadata:
  annotations:
    kubectl.kubernetes.io/last-applied-configuration: |
      {"apiVersion":"v1","data":{"config.yml":"\"modules\":\n  \"http_2xx\":\n    \"http\":\n      \"preferred_ip_protocol\": \"ip4\"\n    \"prober\": \"http\"\n  \"http_post_2xx\":\n    \"http\":\n      \"method\": \"POST\"\n      \"preferred_ip_protocol\": \"ip4\"\n    \"prober\": \"http\"\n  \"irc_banner\":\n    \"prober\": \"tcp\"\n    \"tcp\":\n      \"preferred_ip_protocol\": \"ip4\"\n      \"query_response\":\n      - \"send\": \"NICK prober\"\n      - \"send\": \"USER prober prober prober :prober\"\n      - \"expect\": \"PING :([^ ]+)\"\n        \"send\": \"PONG ${1}\"\n      - \"expect\": \"^:[^ ]+ 001\"\n  \"pop3s_banner\":\n    \"prober\": \"tcp\"\n    \"tcp\":\n      \"preferred_ip_protocol\": \"ip4\"\n      \"query_response\":\n      - \"expect\": \"^+OK\"\n      \"tls\": true\n      \"tls_config\":\n        \"insecure_skip_verify\": false\n  \"ssh_banner\":\n    \"prober\": \"tcp\"\n    \"tcp\":\n      \"preferred_ip_protocol\": \"ip4\"\n      \"query_response\":\n      - \"expect\": \"^SSH-2.0-\"\n  \"tcp_connect\":\n    \"prober\": \"tcp\"\n    \"tcp\":\n      \"preferred_ip_protocol\": \"ip4\""},"kind":"ConfigMap","metadata":{"annotations":{},"labels":{"app.kubernetes.io/component":"exporter","app.kubernetes.io/name":"blackbox-exporter","app.kubernetes.io/part-of":"kube-prometheus","app.kubernetes.io/version":"0.26.0"},"name":"blackbox-exporter-configuration","namespace":"monitoring"}}
  creationTimestamp: "2025-09-07T04:02:13Z"
  labels:
    app.kubernetes.io/component: exporter
    app.kubernetes.io/name: blackbox-exporter
    app.kubernetes.io/part-of: kube-prometheus
    app.kubernetes.io/version: 0.26.0
  name: blackbox-exporter-configuration
  namespace: monitoring
  resourceVersion: "3544349"
  uid: 476f48ab-c434-413b-8e04-3a4a31a8b5ed
10.2. 一次完整的监控流程
以 kube-prometheus 为例:
- 用户 创建 Probe CRD 定义监控目标
- Prometheus Operator 检测到变化,更新 Prometheus 配置
- Prometheus 根据配置向 Blackbox Exporter 发送探测请求
- Blackbox Exporter 对目标服务执行实际探测
- 目标服务 返回响应给 Blackbox Exporter
- Blackbox Exporter 生成指标数据返回给 Prometheus
- Prometheus 存储指标并评估告警规则
- Alertmanager 处理触发的告警并发送通知
- Grafana 从 Prometheus 查询数据展示仪表板
10.3. 黑盒监控 Probe CRD 示例
HTTP 检查:
# blackboxExporter-Probe-http.yaml
apiVersion: monitoring.coreos.com/v1
kind: Probe
metadata:
  name: blackbox-http-2xx
  namespace: monitoring
  labels:
    app: blackbox-probe
    probe-type: http
    team: infrastructure
spec:
  # 对应 job_name
  jobName: blackbox_http_2xx

  # 抓取间隔(默认60s)
  interval: 60s

  # Prober 配置
  prober:
    url: blackbox-exporter.monitoring:19115  # Blackbox Exporter 服务
    path: /probe  # 对应 metrics_path
    # scheme: http  # 可选,默认 http
    # timeout: 10s  # 可选超时时间

  # Blackbox Exporter 使用的模块,确保在 Blackbox Exporter 中定义了对应的模块
  module: http_2xx

  # 目标配置
  targets:
    staticConfig:
      static:
        - https://www.baidu.com
        # 可以添加更多目标
        - https://www.google.com
        - https://prometheus.io


  # 可选:添加额外标签
  # labels:
  #   environment: production
  #   severity: critical

  # 可选:采样限制
# sampleLimit: 10000TCP 检查:
apiVersion: monitoring.coreos.com/v1
kind: Probe
metadata:
  name: prometheus-port-status
  namespace: monitoring
spec:
  jobName: prometheus_port_status
  prober:
    url: blackbox-exporter.monitoring:19115
  module: tcp_connect
  targets:
    staticConfig:
      static:
        - targets: ['172.19.155.133:8765']
SSL 证书过期时间监测:
- 首先在 Blackbox Exporter 中添加 SSL 检查模块
apiVersion: v1
kind: ConfigMap
metadata:
  name: blackbox-exporter-configuration
  namespace: monitoring
  labels:
    app.kubernetes.io/component: exporter
    app.kubernetes.io/name: blackbox-exporter
    app.kubernetes.io/part-of: kube-prometheus
    app.kubernetes.io/version: 0.26.0
data:
  config.yml: |
    modules:
      http_2xx:
        prober: http
        http:
          preferred_ip_protocol: "ip4"
          valid_http_versions: ["HTTP/1.1", "HTTP/2"]
          valid_status_codes: [200]
          method: GET
          headers:
            User-Agent: "Blackbox Exporter/0.26.0"

      http_post_2xx:
        prober: http
        http:
          method: POST
          preferred_ip_protocol: "ip4"
          headers:
            Content-Type: "application/json"
          body: '{"text": "hello"}'

      irc_banner:
        prober: tcp
        tcp:
          preferred_ip_protocol: "ip4"
          query_response:
          - send: "NICK prober"
          - send: "USER prober prober prober :prober"
          - expect: "PING :([^ ]+)"
            send: "PONG ${1}"
          - expect: "^:[^ ]+ 001"

      pop3s_banner:
        prober: tcp
        tcp:
          preferred_ip_protocol: "ip4"
          query_response:
          - expect: "^+OK"
          tls: true
          tls_config:
            insecure_skip_verify: false

      ssh_banner:
        prober: tcp
        tcp:
          preferred_ip_protocol: "ip4"
          query_response:
          - expect: "^SSH-2.0-"

      tcp_connect:
        prober: tcp
        tcp:
          preferred_ip_protocol: "ip4"

      # SSL 证书检查模块
      ssl_cert_check:
        prober: http
        timeout: 15s
        http:
          method: GET
          preferred_ip_protocol: "ip4"
          tls_config:
            insecure_skip_verify: true
          fail_if_ssl: false
fail_if_not_ssl: false- 重启 Blackbox Exporter 加载配置
kubectl -n monitoring rollout restart deployment/blackbox-exporter- Probe CRD 配置
# blackboxExporter-Probe-sslCertificate.yaml
apiVersion: monitoring.coreos.com/v1
kind: Probe
metadata:
  name: ssl-certificate-monitor
  namespace: monitoring
  labels:
    app: ssl-monitor
    team: infrastructure
    monitoring: ssl-certs
spec:
  jobName: ssl_certificate_check
  interval: 3600s  # 每小时检查一次
  scrapeTimeout: 30s
  prober:
    url: blackbox-exporter.monitoring:19115
    path: /probe
  module: ssl_cert_check  # 使用上面定义的模块
  targets:
    staticConfig:
      static:
        # 业务域名(示例)
        - https://pingk.top
- 告警规则
# blackboxExporter-PrometheusRule-sslCertificate.yaml
apiVersion: monitoring.coreos.com/v1
kind: PrometheusRule
metadata:
  name: ssl-certificate-alerts
  namespace: monitoring
  labels:
    app: ssl-alerts
    team: infrastructure
spec:
  groups:
  - name: ssl-certificate.rules
    rules:
    # 证书即将过期告警(30天)
    - alert: SSLCertExpiringSoon
      expr: |
        (probe_ssl_earliest_cert_expiry - time()) / 86400 < 30
        and
        (probe_ssl_earliest_cert_expiry - time()) / 86400 > 0
      for: 5m
      labels:
        severity: warning
        category: ssl
      annotations:
        summary: "SSL证书即将过期 (实例: {{ $labels.instance }})"
        description: |
          SSL证书将在 {{ $value | humanize }} 天后过期。
          当前检查: {{ $labels.instance }}

    # 证书已过期告警
    - alert: SSLCertExpired
      expr: |
        (probe_ssl_earliest_cert_expiry - time()) / 86400 <= 0
      for: 2m
      labels:
        severity: critical
        category: ssl
      annotations:
        summary: "SSL证书已过期 (实例: {{ $labels.instance }})"
        description: |
          SSL证书已经过期!
          当前检查: {{ $labels.instance }}

    # 证书检查失败告警
    - alert: SSLCertCheckFailed
      expr: |
        probe_success == 0
        and
        probe_ssl_earliest_cert_expiry == 0
      for: 5m
      labels:
        severity: critical
        category: ssl
      annotations:
        summary: "SSL证书检查失败 (实例: {{ $labels.instance }})"
        description: |
          无法检查SSL证书状态,可能网络问题或服务不可用。
          目标: {{ $labels.instance }}

    # 证书有效期过短告警(小于7天)
    - alert: SSLCertVeryShortLifetime
      expr: |
        (probe_ssl_earliest_cert_expiry - time()) / 86400 < 7
        and
        (probe_ssl_earliest_cert_expiry - time()) / 86400 > 0
      for: 5m
      labels:
        severity: critical
        category: ssl
      annotations:
        summary: "SSL证书有效期非常短 (实例: {{ $labels.instance }})"
        description: |
          SSL证书只剩 {{ $value | humanize }} 天有效期!
          建议立即续期。